SpringBoot(一) 启动与自动配置
SpringBoot(二) starter与servlet容器
SpringBoot(三) Environment
SpringBoot(四) 集成apollo遇到的事儿
SpringBoot(五) 健康检查(上)
SpringBoot(六) 健康检查(下)
配置
springBoot提供的健康检查只需要引入依赖即可:
<dependency>
	<groupId>org.springframework.boot</groupId>
	<artifactId>spring-boot-starter-actuator</artifactId>
</dependency>
spring-boot-starter-actuator其实只是个空项目,统一管理的引入了:
// 自动配置
+ spring-boot-actuator-autoconfigure
	// actuator
	+ spring-boot-actuator
// 提供了记录度量指标类
// SpringBoot 2.X使用mircrometer进行统计数据和发布数据到监控系统,1.X是使用了dropwizard-metrics
+ micrometer-core
启动项目,可以看到打印了Exposing 2 endpoint(s) beneath base path '/actuator',我们访问这个路径看到打印了:
{
	"_links": {
		"self": {
			"href": "http://127.0.0.1:8080/actuator",
			"templated": false
		},
		"health-component": {
			"href": "http://127.0.0.1:8080/actuator/health/{component}",
			"templated": true
		},
		"health-component-instance": {
			"href": "http://127.0.0.1:8080/actuator/health/{component}/{instance}",
			"templated": true
		},
		"health": {
			"href": "http://127.0.0.1:8080/actuator/health",
			"templated": false
		},
		"info": {
			"href": "http://127.0.0.1:8080/actuator/info",
			"templated": false
		}
	}
}
其实在SpringBoot2.X以前,有许多监控端点是打开的,比如env、beans等。但是2.X以后有以下规则:
1、要通过actuator暴露端点,必须同时是启用(enabled)的和暴露(exposed)的
2、所有除了/health和/info的端点,默认都是不暴露的
3、所有除了/shutdown的端点,默认都是启用的(enabled)
4、生产环境由于安全性的问题,注意不要暴露敏感端点(如果使用Spring Security,则可以使用Spring Security的内容协商策略保护端点)
所以通过application.properties或application.ymal配置可以打开这些监控端点:
#management.endpoints.enabled-by-default=true
// 启用指定监控端点,只有shutdown是默认未启用的
management.endpoint.shutdown.enabled=true

// 只暴露/排除指定监控端点,可以使用*表示全部
// 全部暴露,除了env端点
management.endpoints.web.exposure.include=*
management.endpoints.web.exposure.exclude=env

// 一个链接所有端点的”discovery页面”被添加,默认情况下,”discovery页面”在/actuator上可用
// 修改访问根路径,使用配置自定义的管理上下文路径,”discovery页面”自动从/actuator移动到管理上下文的根
management.endpoints.web.base-path=/monitor
// 修改端口映射,改变端点路径,比如重新映射/monitor/health到/monitor/healthcheck
management.endpoints.web.path-mapping.health=healthcheck

// <name>端点缓存的生存时间设置为10秒
management.endpoint.<name>.cache.time-to-live=10s

// CORS跨源资源共享设置,指定授权的跨域请求
management.endpoints.web.cors.allowed-origins=http://example.com
management.endpoints.web.cors.allowed-methods=GET,POST
// 使用不同的HTTP端口来公开端点
management.server.port=8081
management.server.XXX=xxx


//激活所有的JMX方式请求
management.endpoints.jmx.exposure.include=*
#management.endpoints.jmx.exposure.exclude=
// 不暴露JMX端点
#endpoints.jmx.enabled=false
这样启动后就会看到Exposing 12 endpoint(s) beneath base path '/monitor'
| 类型 | 名称 | 作用 |
|---|---|---|
| Sensor | auditevents | 显示当前应用程序的审计事件信息。需要一个AuditEventRepository bean |
| beans | 显示应用中所有Spring Beans的完整列表 | |
| caches | 显示公开可用缓存的信息 | |
| conditions | 显示自动装配类的状态及及应用信息 | |
| configprops | 显示所有@ConfigurationProperties列表 |
|
| env | 显示 ConfigurableEnvironment 中的属性 | |
| info | 提供当前SpringBoot应用的任意信息,可以通过Environment或application.properties等形式提供以info.为前缀的任何配置项,然后info这个endpoint就会将这些配置项的值作为信息的一部分展示出来 | |
| health | 显示应用的健康信息(未认证只显示status,认证显示全部信息详情) | |
| metrics | 当前SprinBoot应用的metrics信息 | |
| httptrace | 显示HTTP跟踪信息(默认显示最后100个HTTP请求 - 响应交换) | |
| mappings | 如果是基于SpringMVC的Web应用,显示所有@RequestMapping路径集列表 |
|
| scheduledtasks | 显示应用程序中的计划任务 | |
| sessions | 允许从Spring会话支持的会话存储中检索和删除用户会话 | |
| Actuator | shutdown | 用于关闭当前SpringBoot应用的endpoint |
| dump | 用于执行线程的dump操作,heapdump和threaddump |
使用
如果要做一个应用是否启动的检查,其实很简单,我们可以直接使用Spring MVC的rest访问即可;
@RestController
public class HealthController {

    @GetMapping("myhealth")
    public Health myHealth() {
        return new Health("UP");
    }

}

public class Health {
    private String status;
	// ...
}
可以得到{"status":"UP"}的结果,那么改动方法内的实现,也可以完成类似简易的健康检查
上面那种方式其实只是依赖了Spring MVC,言归正传,使用actuator一般可以使用其health或metrics的扩展,或自定义endpoint
health健康信息
health端点公开的信息取决于management.endpoint.health.show-details属性,可以使用以下值之一配置:
1、never:默认,不显示细节
2、when-authorized:详细信息只显示给授权用户,可以使用management.endpoint.health.roles配置授权角色(当用户处于端点的一个或多个角色中时,就被认为是经过授权的,如果端点没有配置角色(默认),则认为所有经过身份验证的用户都是经过授权的)
3、always:详细信息显示给所有用户
健康信息是从ApplicationContext中定义的所有HealthIndicator bean中收集的,Spring Boot包括许多自动配置的HealthIndicators,并且你也可以自己写。默认情况下,最终的系统状态由HealthAggregator派生,它根据有序的状态列表从每个HealthIndicator排序状态。排序列表中的第一个状态被用作总体健康状态,如果没有HealthAggregator所知道的HealthIndicator状态返回,则使用UNKNOWN状态
比如Spring Boot提供了一些自动配置的HealthIndicators:
1、CassandraHealthIndicator:检查Cassandra数据库是否已启动
2、DiskSpaceHealthIndicator:检查低磁盘空间
3、DataSourceHealthIndicator:检查能否获得到DataSource的连接
4、RedisHealthIndicator:检查Redis服务是否已启动
等等
自定义HealthIndicators
要提供自定义的健康信息,可以注册实现HealthIndicator接口的Spring bean,并提供health()方法的实现并返回Health响应
给定HealthIndicator的标识符是没有HealthIndicator后缀的bean的名称,例如MyHealthIndicator的健康信息可以在my条目中获得
对于多个HealthIndicator的status,spring boot默认对其进行aggregrate自动聚合,然后计算最顶层的status字段。对于status是DOWN或者是OUT_OF_SERVICE的,返回的http的状态码是503,这样应用监控系统一来就无需去解析返回结果,直接根据http的状态码就可以判断了,非常方便
除了Spring Boot的预定义Status类型之外,Health还可以返回表示新系统状态的自定义Status,在这种情况下,还需要提供HealthAggregator接口的自定义实现,或者,默认实现是使用management.health.status.order配置属性:
// 一个带有代码FATAL的新Status
management.health.status.order=FATAL, DOWN, OUT_OF_SERVICE, UNKNOWN, UP
// 通过HTTP访问健康端点,可能还想注册自定义状态映射
management.health.status.http-mapping.FATAL=503
已有的默认状态:
1、DOWN:SERVICE_UNAVAILABLE (503)
1、OUT_OF_SERVICE:SERVICE_UNAVAILABLE (503)
1、UP:默认情况下没有映射,所以http状态是200
1、UNKNOWN:默认情况下没有映射,所以http状态是200
第一种方式,直接实现HealthIndicator接口
@Component("my_health_indicator")
public class MyHealthIndicator implements HealthIndicator {

    @Override
    public Health health() {
		// 简单打印
        return Health.up().withDetail("code", "0000").withDetail("msg","SUCCESS").up().build();
    }
}
可以通过http://127.0.0.1:8080/actuator/health或直接http://127.0.0.1:8080/actuator/health/my_health_indicator查看
另一种方式,继承AbstractHealthIndicator抽象类,这是通常的做法,只需要实现doHealthCheck方法,比如我们实现一个通用的dubbo依赖的健康检查,利用EchoService判断
public class DubboHealthIndicator extends AbstractHealthIndicator {

    private final ReferenceBean bean;

    public DubboHealthIndicator(ReferenceBean bean) {
        this.bean = bean;
    }

    @Override
    protected void doHealthCheck(Health.Builder builder) throws Exception {
        builder.withDetail("interface", bean.getObjectType());
        final EchoService service = (EchoService) bean.getObject();
        service.$echo("ok");
        builder.up();
    }
}
实现了HealthIndicator后,就需要注册在IOC中了,我们可以为所有dubbo服务的ReferenceBean都注册了,这样就不必为每个服务单独注册了,还可以做成starter自动配置(写入META-INF/spring.factories),这样就自动对当前应用引用的所有dubbo服务进行健康检查了
@Configuration
@ConditionalOnClass(name = { "com.alibaba.dubbo.rpc.Exporter" })
public class DubboHealthIndicatorConfiguration {

    @Autowired
    StatusAggregator healthAggregator;

    @Autowired(required = false)
    Map<String, ReferenceBean> references;

    @Bean
    public CompositeHealthContributor dubboHealthIndicator() {
        Map<String, HealthIndicator> indicators = new HashMap<>();
        for (String key : references.keySet()) {
            final ReferenceBean bean = references.get(key);
            indicators.put(key.startsWith("&") ? key.replaceFirst("&", "")
                    : key, new DubboHealthIndicator(bean));
        }
        return CompositeHealthContributor.fromMap(indicators);
    }

}
其中对于references,Spring框架支持依赖注入Key的类型为String的Map,遇到这种类型的Map声明,Spring将扫描容器中所有类型为T(这里为ReferenceBean)的bean,然后以该bean的name作为Map的Key,以bean实例作为对应的Value,从而构建一个Map并注入到依赖处
如前面说的,通过health下的/dubbo即可以访问,反应项目中所有dubbo服务的整体健康状况
ReactiveHealthIndicator
对于reactive应用,比如Spring WebFlux,ReactiveHealthContributor提供了非阻塞协议来获取应用程序的运行状况。与HealthContributor类似,健康信息是从ReactiveHealthContributorRegistry的内容中收集的(默认情况下,所有ApplicationContext中定义的HealthContributor实例和ReactiveHealthContributor实例),且ReactiveHealthContributorRegistry可用于在运行时注册和注销健康指标
- Reactive以后研究
metrics数据指标
metrics就是一个度量指标的执行器,可以进行类似仪表盘的展示
自定义metrics
通用标签
@Bean
MeterRegistryCustomizer<MeterRegistry> metricsCommonTags() {
	return registry -> registry.config().commonTags("region", "cn/east8");
}
第一种方式,注册到MeterRegistry
@Component
public class SampleBean {

    private final Counter counter;

    public SampleBean(MeterRegistry registry) {
        this.counter = registry.counter("received.messages");
		// registry.gauge("other", counter, c -> {counter.increment();return c.count();} );
    }

    public void handleMessage(String message) {
        this.counter.increment();
        // handle message implementation
    }
}
通过http://localhost:8080/actuator/metrics/received.messages访问,但该类的handleMessage被调用后,counter自增
第二种方式,实现MeterBinder
@Component
public class MyMetrics implements MeterBinder {

    AtomicInteger count = new AtomicInteger(0);

    @Override
    public void bindTo(MeterRegistry registry) {
		// count指标
        Gauge.builder("count", count, c -> c.incrementAndGet())
                .tags("pv", "Page View")
                .description("test of custom meter binder")
                .register(registry);
    }
}
通过http://localhost:8080/actuator/metrics/count访问,这个指标会随着每次访问递增
endpoint执行器端点
执行器端点(endpoints)可用于监控应用及与应用进行交互, 端点暴露的方式取决于你采用的技术类型,大部分应用选择HTTP监控(Web),端点的ID映射到一个URL,也可以使用JMX
端点上的操作通过它们的参数接收输入,当通过web公开时,这些参数的值取自URL的查询参数和JSON请求体,当通过JMX公开时,参数被映射到MBean操作的参数。默认情况下不需要参数,可以使用@org.springframework.lang.Nullable对它们进行注解,从而使它们成为可选的
如果需要,传递给端点操作方法的参数将自动转换为所需的类型,在调用操作方法之前,使用ApplicationConversionService实例将通过JMX或HTTP请求接收的输入转换为所需的类型
Web端点
在web公开的端点上,每个操作都会自动生成一个请求谓词,谓词的路径由端点的ID和web公开端点的基本路径决定,比如/actuator + /info。再通过使用@Selector注解操作方法的一个或多个参数,可以进一步定制路径,这样的参数作为路径变量添加到路径谓词,当调用端点操作时,将变量的值传递给操作方法
谓词的HTTP方法由操作类型决定,如下所示:
@ReadOperation     => GET
@WriteOperation    => POST
@DeleteOperation   => DELETE
谓词的生产子句可以由@DeleteOperation、@ReadOperation和@WriteOperation注解的produces属性确定,属性是可选的,如果不使用,则自动确定”生成”子句。如果操作方法produces返回void,则生成子句为空,如果操作方法返回一个org.springframework.core.io.Resource,生成子句是application/octet-stream。对于所有其他操作,生成子句是application/vnd.spring-boot.actuator.v2+json, application/json
对于使用请求体的@WriteOperation(HTTP POST),谓词的消费子句是application/vnd.spring-boot.actuator.v2+json, application/json,对于所有其他操作,消费子句为空
自定义endpoint
@Component
@Endpoint(id = "hello")
public class MyEndpoint {

    @ReadOperation
    public String hello(@Selector String name) {
		// 简单实现
        return "hello " + name;
    }

}
这样我们可以直接通过http://127.0.0.1:8080/actuator/hello/{name}来访问这个web公开端点
JMX端点
对于JMX公开端点,SpringBoot会用JmxEndpointExporter将所有Endpoint实例以JMX MBean的形式暴露,默认情况下这些Endpoint对应的JMX MBean会放在org.springframework.boot命名空间下面,不过可以通过endpoints.jmx.domain配置项进行更改,比如 endpoints.jmx.domain=com.test.management
JMX和HTTP是endpoints对外开放访问最常用的方式,鉴于Java的序列化漏洞以及JMX的远程访问防火墙问题,因此建议用HTTP并配合安全防护将SpringBoot应用的endpoints开放给外部监控者使用
MBean的名称通常是从端点的id生成的。 例如,health端点暴露为 org.springframework.boot/Endpoint/healthEndpoint。
如果应用程序包含多个Spring ApplicationContext,可能会发现名称发生冲突。 要解决此问题,可以将endpoints.jmx.unique-names属性设置为true,以便MBean名称始终是唯一的
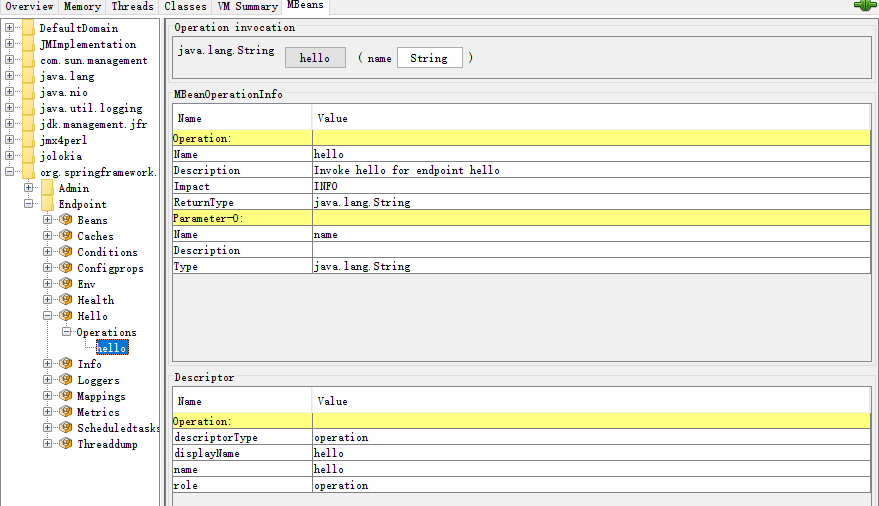
在尝试访问的时候遇到一个坑,因为我用的Spring Boot 2.2.2版本,在jconsole中并没有找到endpoint,在JmxEndpointDiscoverer中debug也没有进来,然后看到JmxEndpointAutoConfiguration上的注解ConditionalOnProperty发现原来需要打开JMX,默认是false的
// 打开JMX
spring.jmx.enabled=true
然后在jconsole中就能看到endpoint节点,并能查看端点信息和操作了
 在此之外,配上
jolokia,完全兼容并支撑JMX组件,它可以当做JMX-HTTP的桥梁可以让我们通过HTTP访问JMX
<dependency>
	<groupId>org.jolokia</groupId>
	<artifactId>jolokia-core</artifactId>
	<version>1.6.2</version>
</dependency>
于是就能通过http://127.0.0.1:8080/actuator/jolokia/read/org.springframework.boot:name=Hello,type=Endpoint访问了,也可以通过http://127.0.0.1:8080/actuator/jolokia/list查看列表
其他
Servlet端点
Servlet可以通过实现一个带有@ServletEndpoint注解的类来作为端点公开,这个类也实现了Supplier<EndpointServlet>。Servlet端点提供了与Servlet容器更深层次的集成,但暴露了可移植性,它们用于将现有的Servlet公开为端点。对于新的端点,应该尽可能使用@Endpoint和@WebEndpoint注解
Controller端点
可以使用@ControllerEndpoint和@RestControllerEndpoint实现仅由Spring MVC或Spring WebFlux公开的端点,方法使用Spring MVC和Spring WebFlux(如@RequestMapping和@GetMapping)的标准注解进行映射,使用端点的ID作为路径的前缀。Controller端点提供了与Spring web框架的更深入的集成,但却牺牲了可移植性,尽可能使用@Endpoint和@WebEndpoint注解
info信息
应用信息会暴露所有InfoContributor beans收集的各种信息,Spring Boot包含很多自动配置的InfoContributors。例如EnvironmentInfoContributor、GitInfoContributor、BuildInfoContributor
我们可以在application.properties中配置Spring属性info.*,比如info.msg=good morning,也可以不硬编码info.app.encoding=@project.build.sourceEncoding@
同样也可以自定义
@Component
public class MyInfoContributor implements InfoContributor {

    @Override
    public void contribute(Info.Builder builder) {
        builder.withDetail("myInfo",
                Collections.singletonMap("myKey", "myValue"));
    }
}
通过http://localhost:8080/actuator/info访问结果
源码解析
autoconfigure包
首先打开spring-boot-actuator-autoconfigure包,查看它的spring.factories,可以看到配置了许多配置类,都是其org.springframework.boot.actuate.autoconfigure路径下的文件
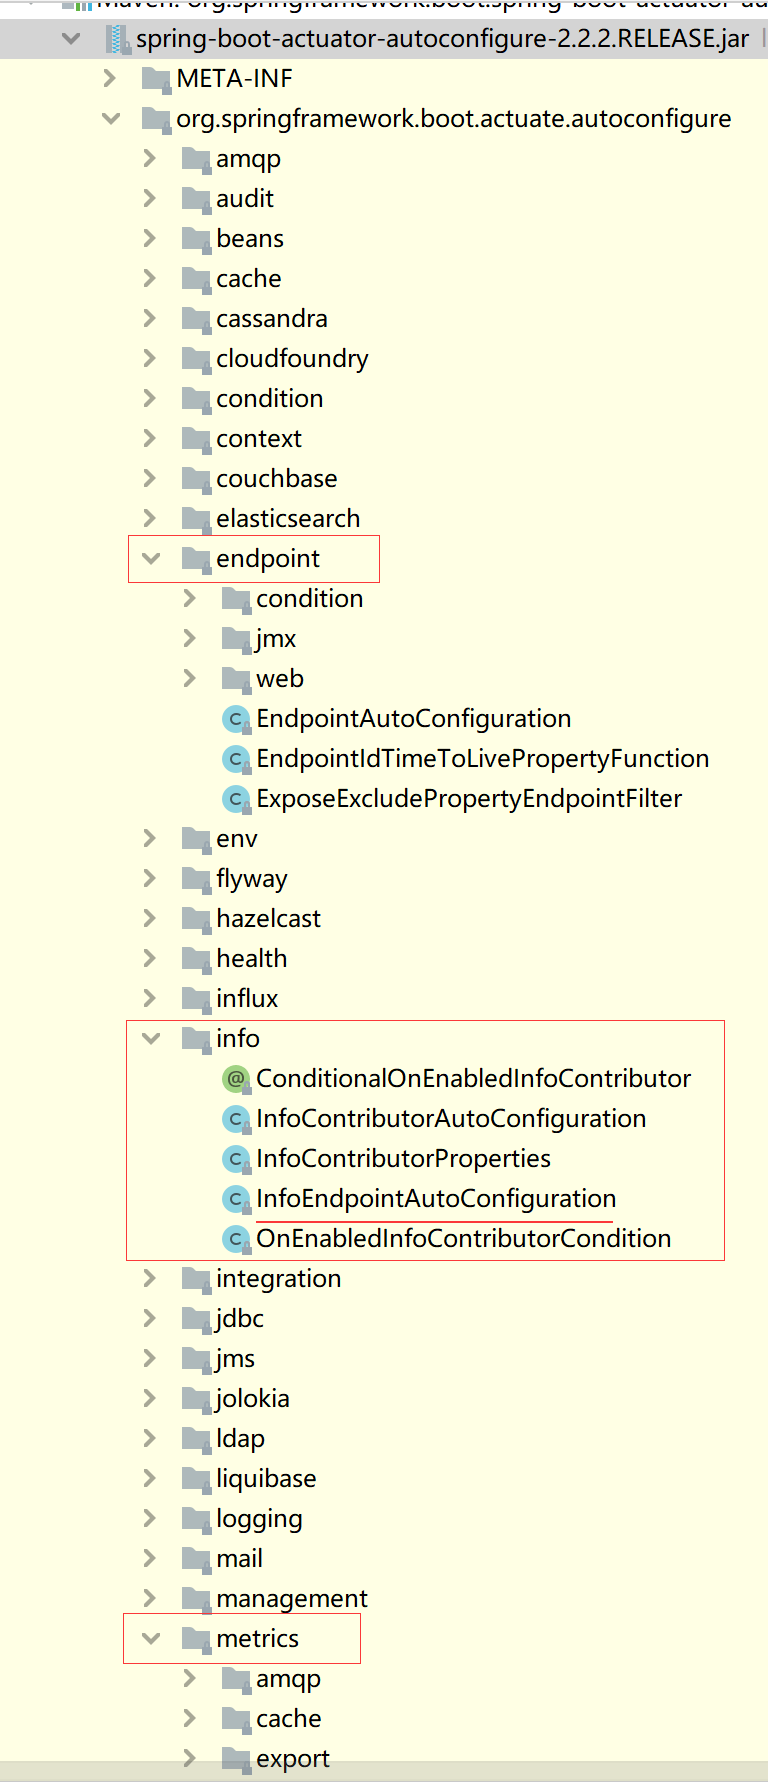
总体而言,autoconfigure下可以分为3类:
1、自动配置XX端点(例如info)
2、endpoint包
3、metrics包
1.自动配置
自动配置的一种方式是,定义了各种XXXEndpointAutoConfiguration,比如rabbitmq、cache、bean等。其中会根据某些类(依赖)是否存在来自动创建XXXEndpoint,这些类使用@Endpoint注解类,@ReadOperation、@WriteOperation或@DeleteOperation注解方法(自动地通过JMX公开,在web应用程序中会通过HTTP公开)。也可以使用@JmxEndpoint或@WebEndpoint来编写特定于技术的端点,这些端点仅限于各自的技术,分别通过JMX公开和HTTP公开。此外,可以使用@EndpointWebExtension和@EndpointJmxExtension编写特定于技术的扩展,这些注解允许你提供特定于技术的操作,以增强现有的端点。最后,如果需要访问特定于web框架的功能,可以实现Servlet或Spring的@Controller和@RestController端点,代价是它们在JMX上不可用,或者在使用不同的web框架时不可用
@Configuration(proxyBeanMethods = false)
@ConditionalOnAvailableEndpoint(endpoint = InfoEndpoint.class)
@AutoConfigureAfter(InfoContributorAutoConfiguration.class)
public class InfoEndpointAutoConfiguration {

	@Bean
	@ConditionalOnMissingBean
	public InfoEndpoint infoEndpoint(ObjectProvider<InfoContributor> infoContributors) {
		return new InfoEndpoint(infoContributors.orderedStream().collect(Collectors.toList()));
	}
}
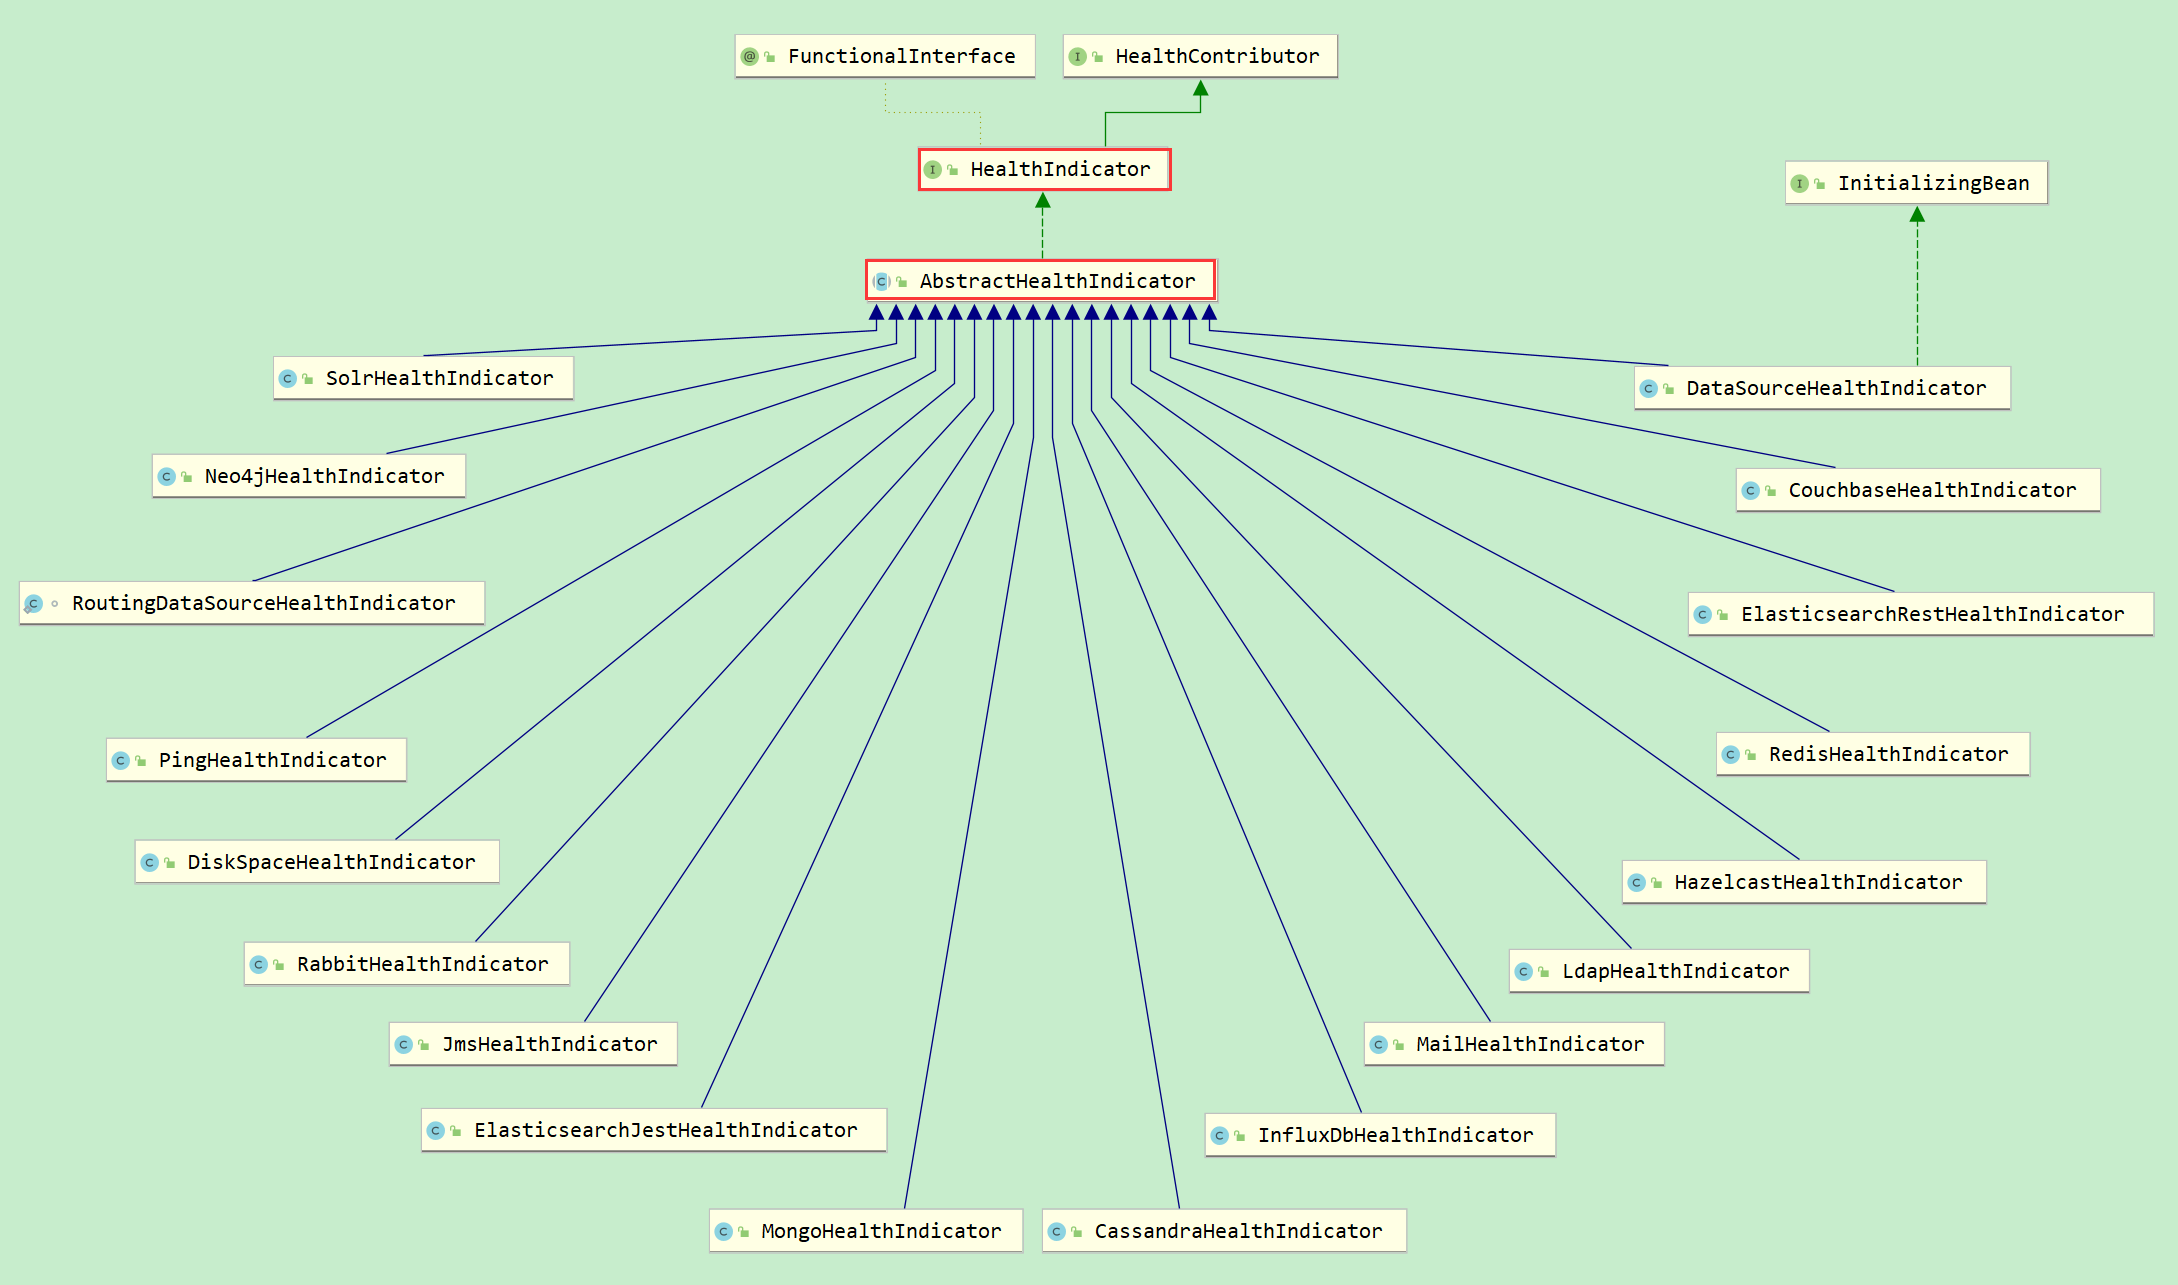
另一种是创建XXXHealthIndicator,这些类继承了AbstractHealthIndicator抽象类,实现了doHealthCheck方法,扩展了health端点。比如solr、redis、dataSource等
此外与spring.factories同级下还有spring-autoconfigure-metadata.properties和spring-configuration-metadata.json配置文件,这2个只是格式不同,都是通过XXXProperties为部分XXXEndpointAutoConfiguration提供参数的
2.endpoint包
主要有3部分组成:
1、Condition:判断是否启用Endpoint
2、JMX导出:创建bean(JmxEndpointDiscoverer、JmxEndpointExporter、ExposeExcludePropertyEndpointFilter)
3、WEB导出:按依赖分别创建Jersey、Reactive、Spring MVC3种定义的XXXEndpointHandlerMapping。由WebEndpointAutoConfiguration创建PathMapper、WebEndpointDiscoverer、ControllerEndpointDiscoverer、PathMappedEndpoints和ExposeExcludePropertyEndpointFilter
即如果你添加一个带@Endpoint注解的@Bean,那么任何带@ReadOperation、@WriteOperation或@DeleteOperation的方法都会自动地通过JMX公开,在web应用程序中,也会通过HTTP公开,可以使用Jersey、Spring MVC或Spring WebFlux通过HTTP公开端点
首先回过来看一下之前application.properties配置endpoints启用是怎么生效的:
// OnAvailableEndpointCondition
public ConditionOutcome getMatchOutcome(ConditionContext context, AnnotatedTypeMetadata metadata) {
	// 1. 判断是否启用,enabled配置,
	ConditionOutcome enablementOutcome = getEnablementOutcome(context, metadata,
			ConditionalOnAvailableEndpoint.class);
	if (!enablementOutcome.isMatch()) {
		return enablementOutcome;
	}
	ConditionMessage message = enablementOutcome.getConditionMessage();
	Environment environment = context.getEnvironment();
	if (CloudPlatform.CLOUD_FOUNDRY.isActive(environment)) {
		return new ConditionOutcome(true, message.andCondition(ConditionalOnAvailableEndpoint.class)
				.because("application is running on Cloud Foundry"));
	}
	AnnotationAttributes attributes = getEndpointAttributes(ConditionalOnAvailableEndpoint.class, context,
			metadata);
	EndpointId id = EndpointId.of(environment, attributes.getString("id"));
	Set<ExposureInformation> exposureInformations = getExposureInformation(environment);
	for (ExposureInformation exposureInformation : exposureInformations) {
		// 2. 判断是否导出,expose配置
		if (exposureInformation.isExposed(id)) {
			return new ConditionOutcome(true,
					message.andCondition(ConditionalOnAvailableEndpoint.class)
							.because("marked as exposed by a 'management.endpoints."
									+ exposureInformation.getPrefix() + ".exposure' property"));
		}
	}
	return new ConditionOutcome(false, message.andCondition(ConditionalOnAvailableEndpoint.class)
			.because("no 'management.endpoints' property marked it as exposed"));
}


// 1. AbstractEndpointCondition
// enabled配置,判断指定配置是否启用,因为我们没有配置就用默认
protected ConditionOutcome getEnablementOutcome(ConditionContext context, AnnotatedTypeMetadata metadata,
			Class<? extends Annotation> annotationClass) {
	Environment environment = context.getEnvironment();
	AnnotationAttributes attributes = getEndpointAttributes(annotationClass, context, metadata);
	EndpointId id = EndpointId.of(environment, attributes.getString("id"));
	String key = "management.endpoint." + id.toLowerCaseString() + ".enabled";
	Boolean userDefinedEnabled = environment.getProperty(key, Boolean.class);
	if (userDefinedEnabled != null) {
		return new ConditionOutcome(userDefinedEnabled, ConditionMessage.forCondition(annotationClass)
				.because("found property " + key + " with value " + userDefinedEnabled));
	}
	Boolean userDefinedDefault = isEnabledByDefault(environment);
	if (userDefinedDefault != null) {
		return new ConditionOutcome(userDefinedDefault, ConditionMessage.forCondition(annotationClass).because(
				"no property " + key + " found so using user defined default from " + ENABLED_BY_DEFAULT_KEY));
	}
	boolean endpointDefault = attributes.getBoolean("enableByDefault");
	return new ConditionOutcome(endpointDefault, ConditionMessage.forCondition(annotationClass)
			.because("no property " + key + " found so using endpoint default"));
}

// 2. 查看expose配置,判断是否导出,
boolean isExposed(EndpointId endpointId) {
	String id = endpointId.toLowerCaseString();
	// 这里有我们之前配的env,所以env在这里会返回false
	if (!this.exclude.isEmpty()) {
		if (this.exclude.contains("*") || this.exclude.contains(id)) {
			return false;
		}
	}
	// 这里有我们配置的*,因此跳过
	if (this.include.isEmpty()) {
		if (this.exposeDefaults.contains("*") || this.exposeDefaults.contains(id)) {
			return true;
		}
	}
	// 由于是*,返回true
	return this.include.contains("*") || this.include.contains(id);
}
然后在ConfigurationClassParser类中会根据返回结果判断conditionEvaluator.shouldSkip是否要跳出,如果不跳出,最后会执行doProcessConfigurationClass方法,就会将该endpoint控制器注册到IOC中得以使用
3.metrics包
主要是做绑定数据到MeterRegistry的事情
首先创建MeterRegistryPostProcessor
@Configuration(proxyBeanMethods = false)
@ConditionalOnClass(Timed.class)
@EnableConfigurationProperties(MetricsProperties.class)
@AutoConfigureBefore(CompositeMeterRegistryAutoConfiguration.class)
public class MetricsAutoConfiguration {
	//...
	@Bean
	public static MeterRegistryPostProcessor meterRegistryPostProcessor(ObjectProvider<MeterBinder> meterBinders,
			ObjectProvider<MeterFilter> meterFilters,
			ObjectProvider<MeterRegistryCustomizer<?>> meterRegistryCustomizers,
			ObjectProvider<MetricsProperties> metricsProperties, ApplicationContext applicationContext) {
		return new MeterRegistryPostProcessor(meterBinders, meterFilters, meterRegistryCustomizers, metricsProperties,
				applicationContext);
	}
}
MeterRegistryPostProcessor实现了BeanPostProcessor接口,配置MeterRegistry
@Override
public Object postProcessAfterInitialization(Object bean, String beanName) throws BeansException {
	if (bean instanceof MeterRegistry) {
		getConfigurer().configure((MeterRegistry) bean);
	}
	return bean;
}

private MeterRegistryConfigurer getConfigurer() {
	if (this.configurer == null) {
		boolean hasCompositeMeterRegistry = this.applicationContext
				.getBeanNamesForType(CompositeMeterRegistry.class, false, false).length != 0;
		this.configurer = new MeterRegistryConfigurer(this.meterRegistryCustomizers, this.meterFilters,
				this.meterBinders, this.metricsProperties.getObject().isUseGlobalRegistry(),
				hasCompositeMeterRegistry);
	}
	return this.configurer;
}
配置MeterRegistry,将各个MeterBinder注册到MeterRegistry
// MeterRegistryConfigurer
void configure(MeterRegistry registry) {
	// Customizers must be applied before binders, as they may add custom
	// tags or alter timer or summary configuration.
	// 上面写的全局tag就是在这方法里调用的
	customize(registry);
	addFilters(registry);
	if (!this.hasCompositeMeterRegistry || registry instanceof CompositeMeterRegistry) {
		// 注册
		addBinders(registry);
	}
	if (this.addToGlobalRegistry && registry != Metrics.globalRegistry) {
		Metrics.addRegistry(registry);
	}
}

// 执行各自定义MeterBinder的bindTo方法
private void addBinders(MeterRegistry registry) {
	this.binders.orderedStream().forEach((binder) -> binder.bindTo(registry));
}
然后在MeterRegistryPostProcessor类中传进来的MeterRegistry是SimpleMeterRegistry,其在SimpleMetricsExportAutoConfiguration(spring.factories配置)中被创建
参考:
Spring Boot 参考指南(端点)
production-ready-endpoints